


European Securitisation Statistics – How Does Ireland Perform?
Securitisation statistics
Since the introduction of mandatory Financial Vehicle Corporation (“FVC”) reporting across the EU ten years ago it is possible to get a better picture of the levels of activity for European securitisation vehicles over time and the most favoured jurisdictions for the location of FVCs involved in Securitisation transactions.
The total new issuance of European securitised product in 2019 was €223 billion, the lowest annual volume since 2016 (€180bn) and 25% less than 2018 (€268bn). Source AFME.
Reporting of FVC statistics began in the first quarter of 2010 for the reference period end-December 2009. Statistics are published on a quarterly basis by the European Central Bank, and central banks across Europe collect the data from reporting agents on a quarterly basis. The quarterly data provides details of the types of securitisation transactions, the Euro value of assets and liabilities by European jurisdiction and the numbers of individual tranches issued from each vehicle.
Analysing the data
Taking the data as at 31 December 2019, which is ten years on from the first data collection point, it is clear to see that two jurisdictions account for more than half of the securitisation FVCs across Europe, those being Ireland and Luxembourg.
Q4 2019 – European FVC Data
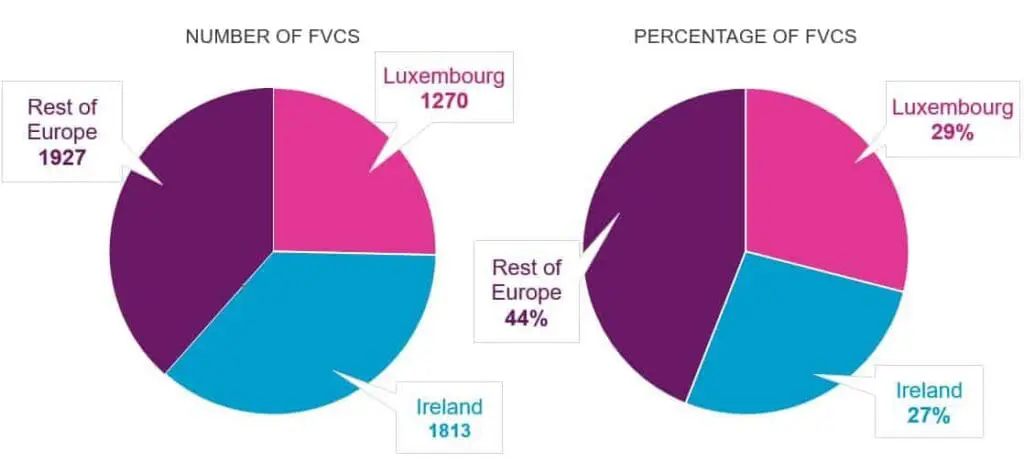
Source: ECB
Irish Securitisation FVCs make up 27% of the total number of FVCs in Europe and almost a quarter of the total assets (up from 24% in 2014). This position has been built up over a long number of years and has led to the development of a substantial ecosystem of legal and tax advisors, corporate service providers, auditors, administrators and trustees. Ireland has distinct advantages including a highly regarded legal, tax and regulatory regime.
Q4 2019 – Irish FVC Assets
| Irish FVC Assets | € Billion | % Total |
| Debt securities | 182 | 38% |
| Securitised loans | 116 | 25% |
| Deposits and loans | 85 | 18% |
| Equity and investment fund units | 38 | 8% |
| Other | 52 | 11% |
| TOTAL | 473 |
Source: ECB
The primary sponsors of Irish FVCs are asset managers and banks. Asset managers have been on the rise in recent years with the return of Collateralised Loan Obligations (CLO) transactions to the market. CLO transactions represent around €104 billion in assets of the total of €473 billion and Ireland is now seen as the jurisdiction of choice in Europe for CLOs resulting in a large increase in market share from 10 years ago and according to ESMA and CBI amount to 90% %. (ESMA total Europe 310, CBI total Ireland 280). Collateralised Debt Obligations (CDO) transactions made up €37 billion.
Securitised loans, mostly RMBS, CMBS and other ABS account for around 116 billion of securitised assets in Irish FVCs. Recent years have seen large issuances of RMBS transactions which now amounts to €56 billion of this category.
Outlook for Ireland
Atlantic Star Consulting undertook a survey in May 2020 to assess the outlook for the Irish SPV sector given the significant market impacts of the COVID-19 pandemic. Commenting on the results of the survey, author Dominick Barrett said that 61% of respondents predicted a decline in the total number of SPVs over the next 12 months, although many respondents were optimistic about areas of growth in the sector and indeed many predicted an increase in numbers. 32% of respondents indicated that CLOs would be the most important vehicle type for new business growth over the next 12 months, with the United States and the United Kingdom likely to be the key jurisdictions where sponsors of new vehicles are located. Given Ireland’s unique position within the European securitisation sector combined with strong growth in its share of the European market over the past decade, the country is well placed to provide a proven domicile for the establishment of FVCs and other structured finance vehicles.
Stay Connected
Stay up to date with expert insights, latest updates and exclusive content.
Discover more
Stay informed with JTC’s latest news, reports, thought leadership, and industry insights.

Let’s Bring Your Vision to Life
From 2,500 employee owners to 14,000+ clients, our journey is marked by stability and success.